Civil War Statistics:
Slaves as a Percentage of the U.S. Population
(1800-1860)
American slavery began in August of 1619, when an English ship, called the White Lion, arrived in the new English colony of Virginia. On board that ship were around two dozen Africans who had originally been enslaved and put aboard a Spanish slave ship. The English ship had seized these African captives from the Spanish, and then tranported them to Virginia, to be sold as slaves. American slavery had begun. Africans and their descendants, now referred to as African-Americans, suffered through slavery in America from 1619 to 1865, when the last slave-holding states were defeated at the end of the American Civil War.
The chart below shows the numbers of Americans in each census year from 1800 to 1860, along with the total population of enslaved African-Americans in the United States (and in the Confederacy). The last column shows the what percentage of the total U.S. population were enslaved. By the time of the next census, in 1870, slavery had been ended.

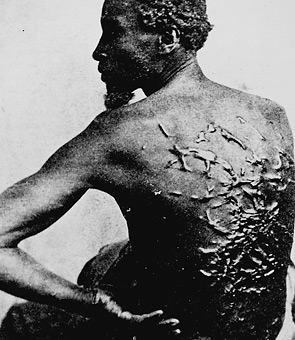
An American Slave with Scars from Whipping.
| 1800 | 5.1 | 0.9 | 17.6% |
| 1810 | 6.8 | 1.1 | 16.1% |
| 1820 | 10 | 1.5 | 15 % |
| 1830 | 12.8 | 2.0 | 15.6% |
| 1840 | 17 | 2.5 | 14.7% |
| 1850 | 23 | 3.2 | 13.9% |
| 1860 | 31.2 | 4.0 | 12.8% |
NOTE: The population of the Confederate States in 1860 (according to the 1860 U.S. census) stood at 9,103,332. Of that number, 3,521,110 were enslaved African-Americans. Enslaved African-Americans constituted 38.67% of the total population of the Confederate states.
The percentage of Southern families that possessed enslaved people hit 30% in 1860.
Sources on American Slavery:
Various Census reports from 1790 to 1860 provide information on the numbers of enslaved people in the United States, and statistics on slavery. One such report is located at this Census Bureau page on Slavery.
Pages on American Slavery
Slave Rebellions in U.S. History
Slaves as a Percentage of the U.S. Population
“The History Guy” is a Registered Trademark.
